Oil breaks to new highs with more upside seen
Brent crude jumped around 2.5% on Monday to $82 a barrel for the first time in three years. This move higher came on the back of OPEC+ agreeing to continue with 400k barrels per day of supply increment for November.
The market was concerned about a bigger output increase for next month due to the ongoing energy crunch in Asia and Europe. Tight supplies have pushed natural gas and coal prices to the highest level on record, while oil prices have been rising steadily as the world’s recovery from the pandemic continues.
Monthly Brent chart aims for October 2018 high
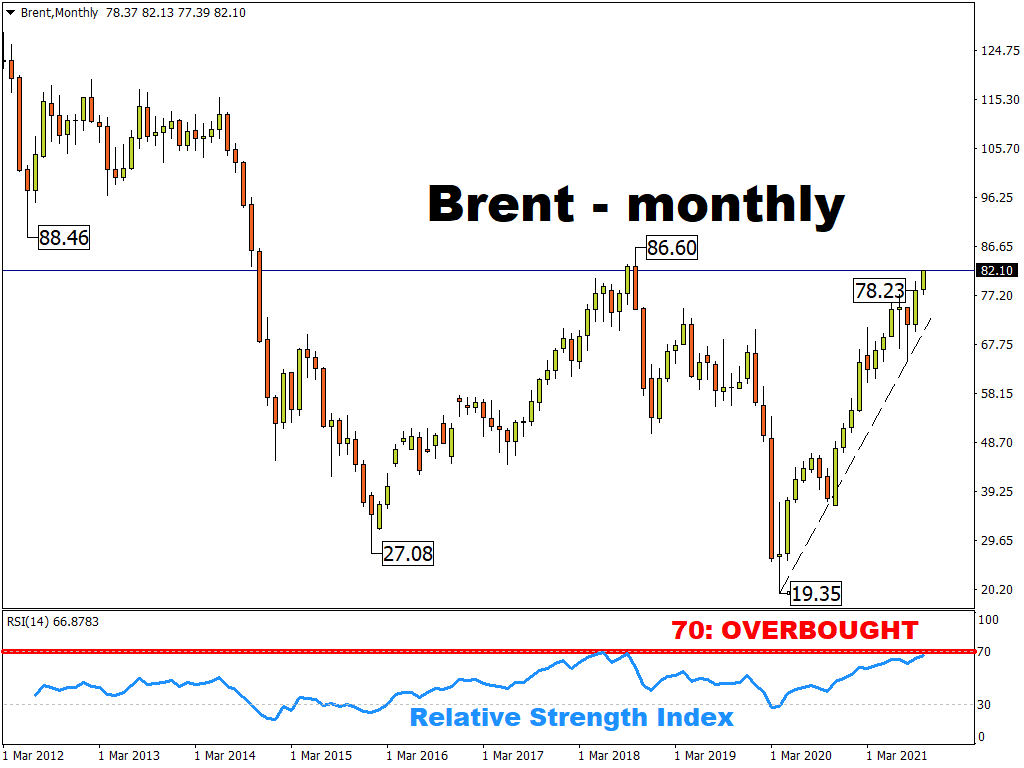
When an asset breaks to new cycle highs, it means we need to view prices on a longer timeframe to see where the next levels of resistance and support lie. We can clearly see an ascending bullish price channel on the Brent crude monthly chart when prices plunged after the pandemic began.
A steady series of higher lows and higher highs have finally seen Brent advance through $75 and the 200-month moving average last month. Bulls have their sights firmly set on the October 2018 high at $86.60. Above here, the spike low from June 2012 sits at $88.46.
Prices are nearing overbought territory on the monthly RSI indicator but are not quite there yet. Trendline support from the pandemic lows around $77.64 will endeavour to keep prices bid. This is also near last month’s close at $78.23.
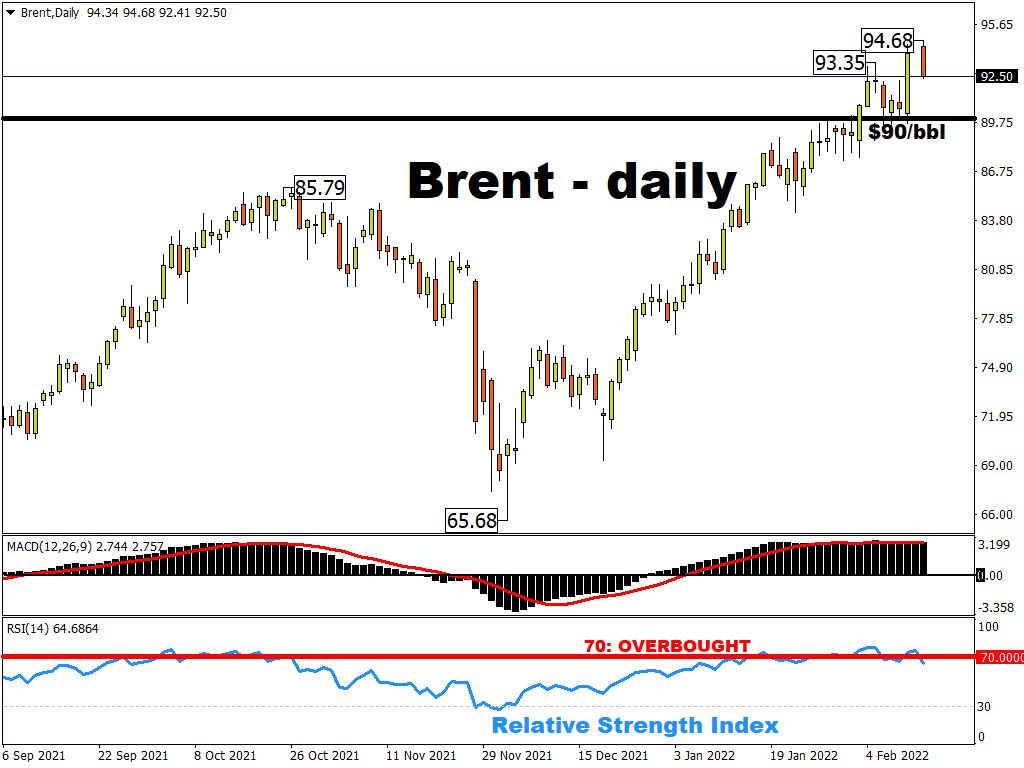
On the daily chart, prices corrected themselves after making a new swing top last week at $79.88. Bullish consolidation above the previous year-to-date highs then set the scene for more gains and today's concerted push towards $82. While bullish momentum is strong, the daily RSI is now in overbought territory. Prices have also pierced the upper Keltner channel so warning of a pullback at some point. The July high at $77.46 should be a first level of support.