What’s next for Gold as Fed meeting looms?
The past few days have rough and rocky for gold.
After struggling to build on the momentum beyond the psychological $1900 level, bears seized control of the steering wheel – dragging prices to as low as $1844.77 this week. Although the current price action confirms that gold remains under pressure on the daily charts, bulls could still be thrown a lifeline.
With that in mind, investors will direct their attention towards the upcoming FOMC meeting for clues on future monetary policy. Given how this has been labelled as a high risk-event, the next few hours could be wild for financial markets. We expect gold to remain highly sensitive to the post-meeting price movements, especially if there is some action in Treasury yields and the Dollar.
The Federal Reserve is widely expected to leave interest rates and policy measures unchanged. However, all eyes will be on the statement language, updated economic projections, the dot plot and Chair Jerome Powell’s post-meeting press conference.
Over the past few weeks, the Fed has managed to persuade markets that the current jump in inflation is transitory. If the central bank strikes a dovish tone, avoids taper talk discussions and continues to preach the ‘transitory’ mantra, this could inject gold bugs with fresh inspiration to retest the psychological $1900 level. Alternatively, a hawkish Fed that offers clarity about the tapering timeline may deal a heavy blow to gold. Such a development has the potential to drag the precious metal towards its 200-day simple moving average and possibly lower.
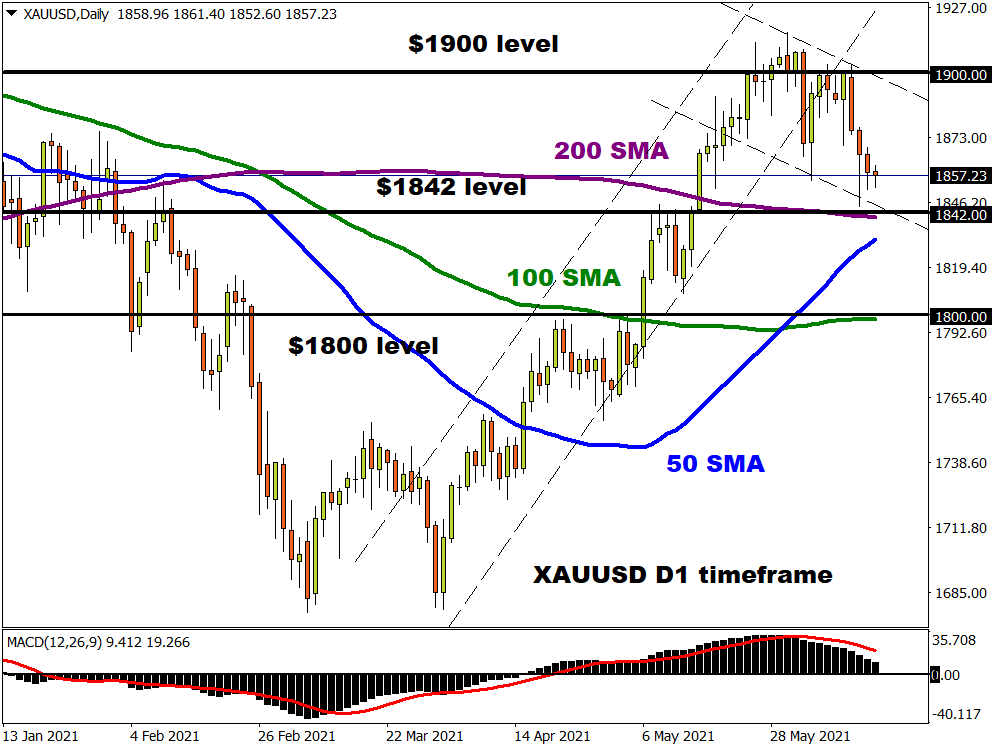
Speaking of the technicals, gold turned bearish on the daily charts after prices slipped below the $1855 support level. A solid daily close below $1855 may confirm the new downtrend with the first level of interest at $1842 which is where the 200-day simple moving average resides. Sustained weakness below $1842 could invite a steeper decline towards $1819 and $1800, respectively.
Should prices experience a sharp rebound back above the $1900 level, this could potentially seal a ‘golden cross’ formation where the 50-day simple moving average crosses above the 200-day simple moving average. This may open the doors towards $1916, $1927 and $1959, respectively.